| These charts show how wide the Spread is Between the Maximum and Minimum of My Sugar |
|
|---|---|
Chart: 7 is for Current 2024-2025 Chart: 6 is for 2024 Chart: 4 is for 2023 Chart: 7 is for Current
2024-2025
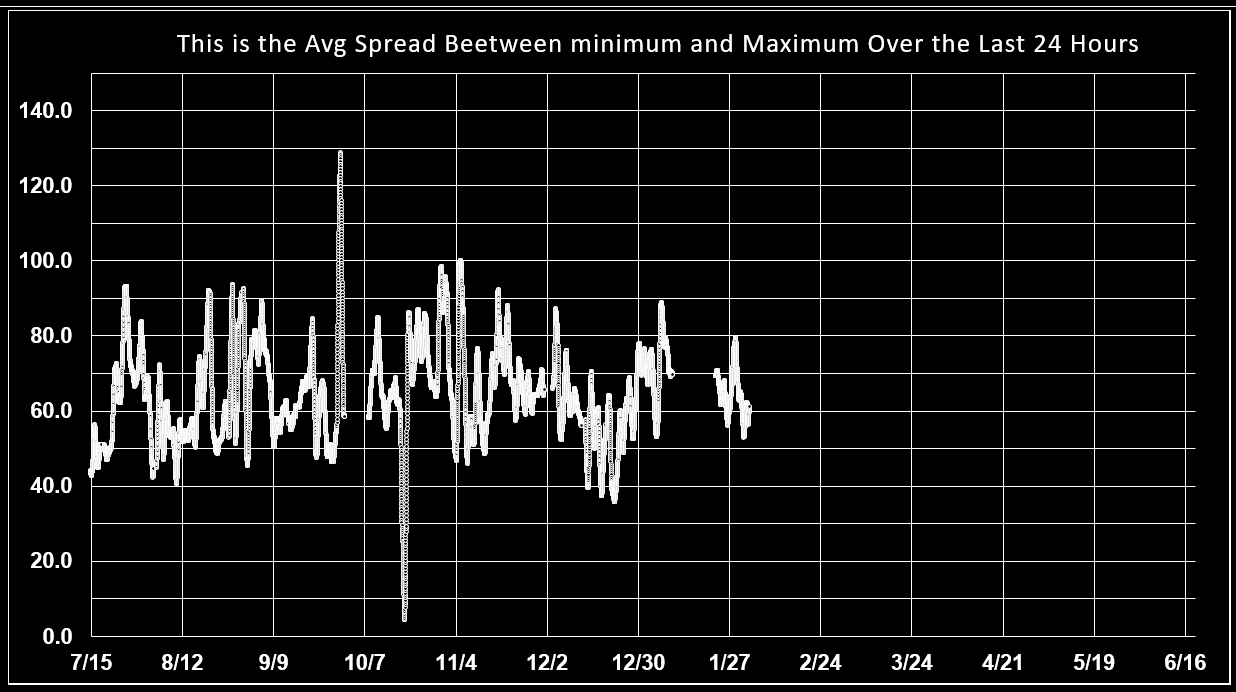 Chart: 6 is for 2024 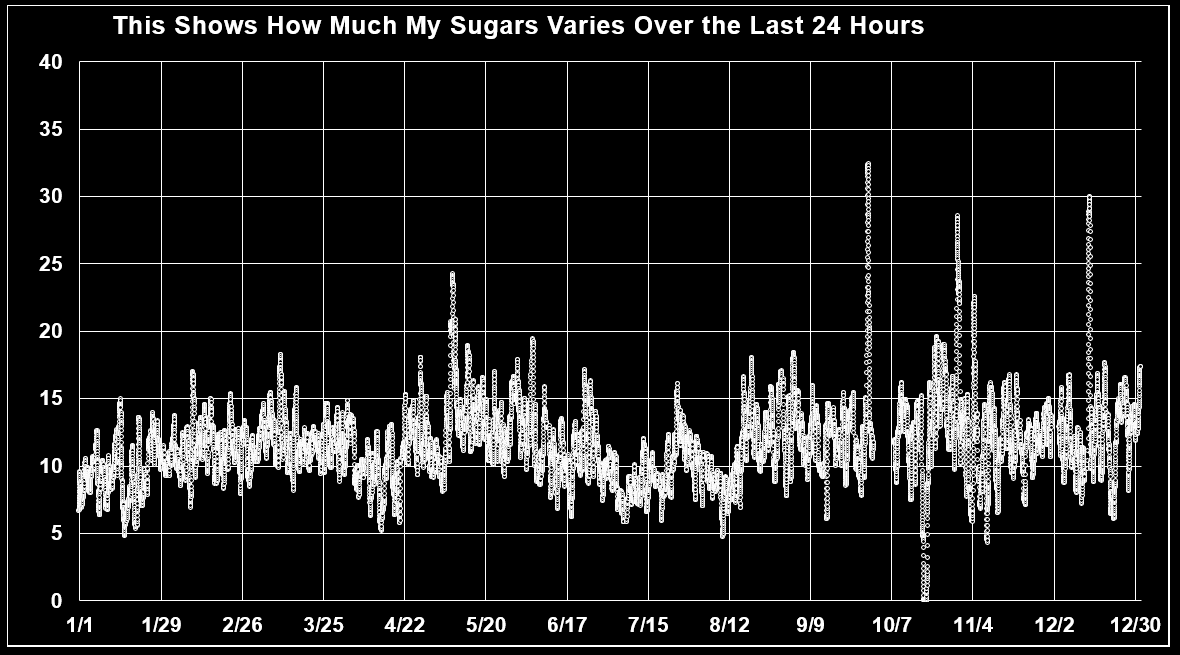 Chart: 5 is for 2023  |
My
Aveage Sugar My Actual
Sugar My Average Sugar My Daily Sugar Spread Between Range
of all My
Sugas Midpoint
of My Sugar How Much
My Sugar |